
The Shift Summary Report allows a user with Dispatch, Manager, or Super Admin access to see a Driver’s shift’s detail report. This tool provides a comprehensive overview of driver activities, including timestamps and mapped locations, for a complete shift analysis.
To locate this report, Navigate to the “Reports” tab on the mynavistream.com website logging in as a Dispatch, Manager, or a Super Admin user.
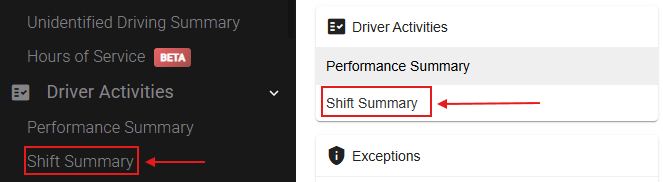
Select the “Shift Summary” report under the “Driver Activity” section either on the middle of the screen, or from the left side menu.
The Shift Summary report is consisted of 4 sections:
Query
Shift Filters
Aggregates
Data Table
Query
Select your “Organization”, “Based on” (Shift Start, or End), “Date range”, or Custom Dates.

Shift Filters
Select desired filters: “Completion” (In Progress, or Completed shifts), “Driver”, “Vehicles”, “Trailers”, “Driver Enabled” (Enabled, or Disabled drivers).

Aggregates
Shows a summary of data for your selected Query, and Filters.

Data Table
Each row represents a Driver’s shift. Note that you have the ability to sort the table by clicking on your desired resources’ column header (Start Time, Driver, Vehicles, etc). You also have the ability to search any resources by typing your desired data in the search box on the top-left side of the table.

By clicking on the  button beside your desired driver’s shift, you will be navigated to its respective shift summary page where you will see a shift summary, and the trip’s map.
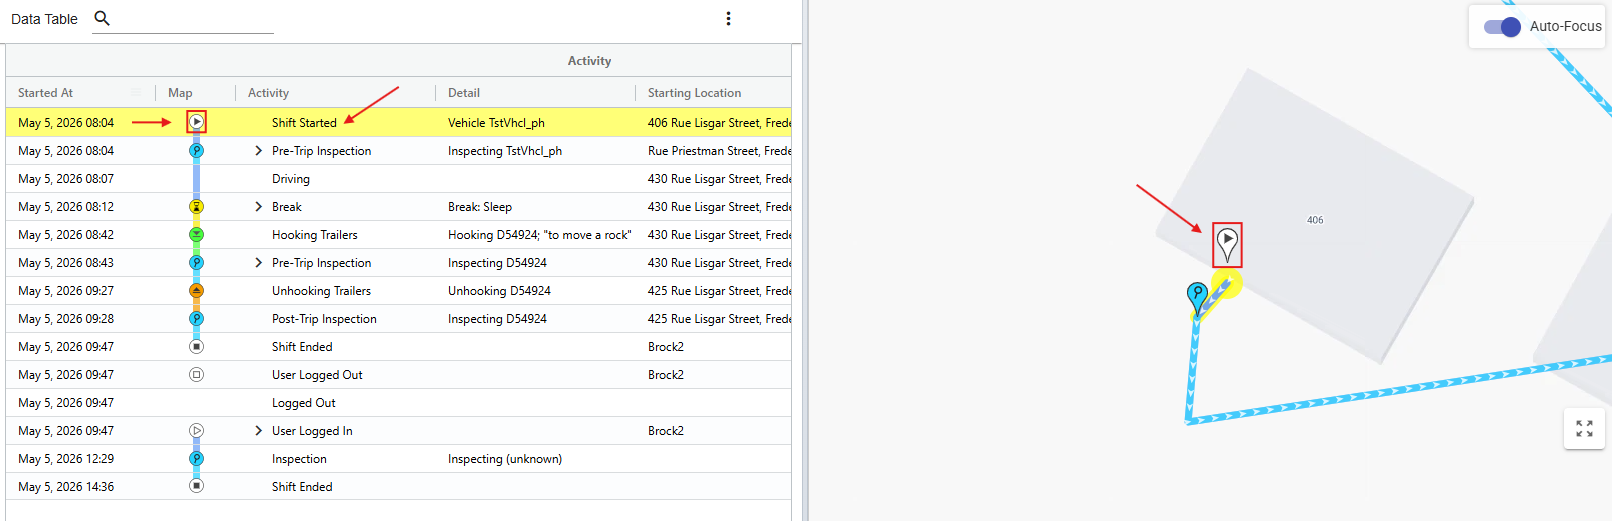
Here you will see Details of the selected driver’s shift, the Aggregates, and a new Data Table with Timestamps, and their Respective Map, Activity, Details, and Starting Location.
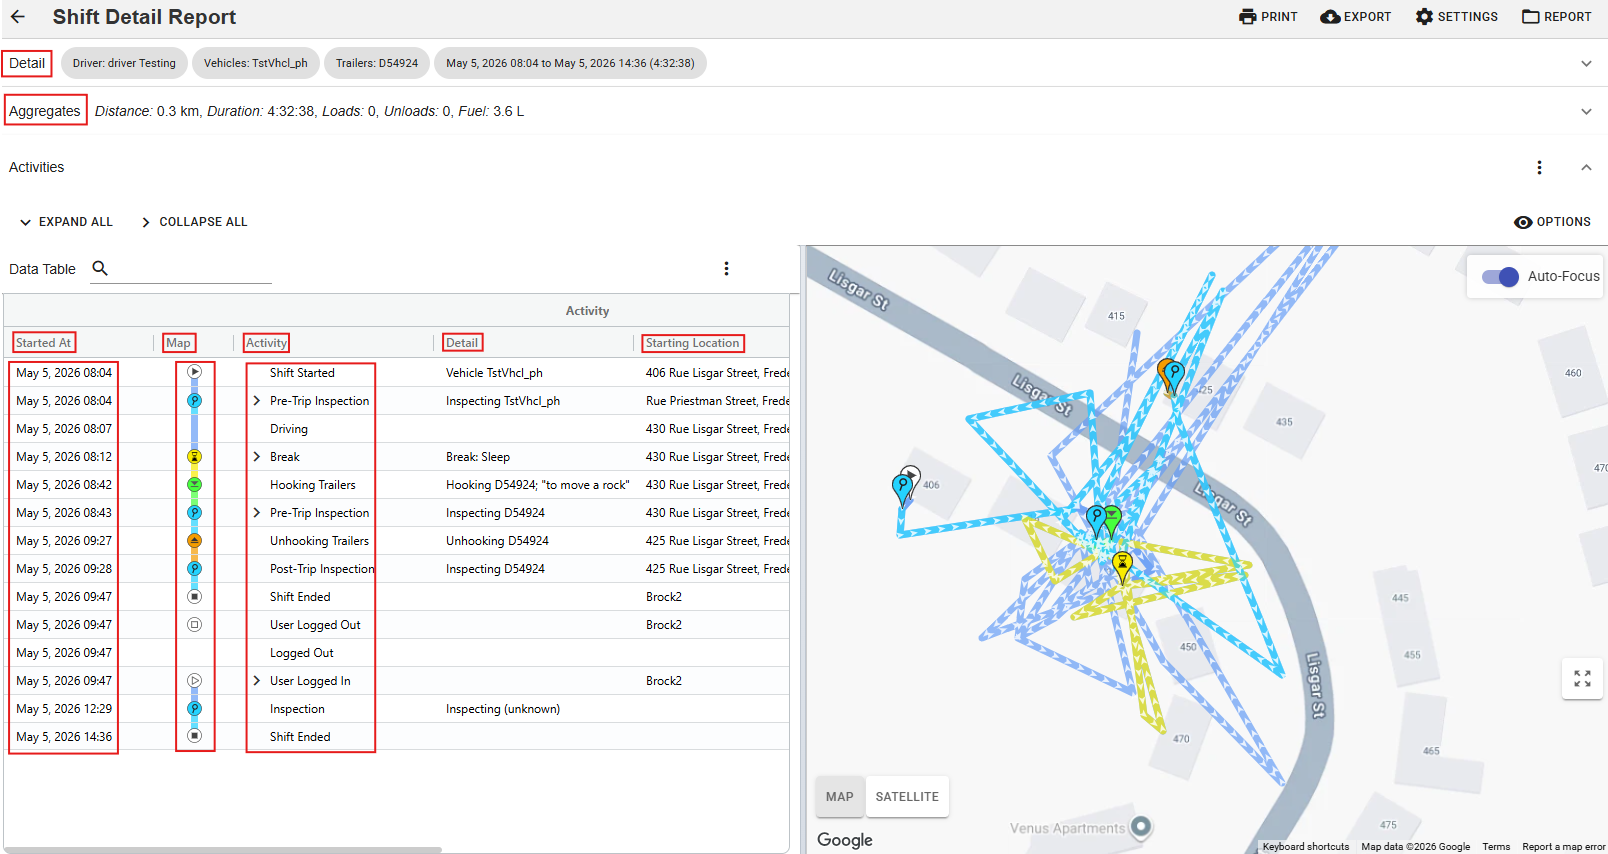
Note that the Data Table is a detailed chart of the Shift Summary report located on the left side of the screen. Here you will find the flow of the drivers day including breaks, stops, activities and other important information. The shift details are built to follow the flow of the drivers day from start to finish.
Note that the Map reveals a start-finish breadcrumb map of the particular shift you've chosen to review. Hover over any icon on the map to provide information about the vehicle at that time of the shift as well as give relevant data such as speed, or activity duration. Each icon is color coded in order to avoid confusion, so users can see exactly where each activity took place.
Note that you can expand each nested activity (Marked with a  ) on the data table to see the details of that activity. Common examples of a nested activity include “Loading” where by expanding it, you will see the details of time spent in Waiting to Load, or the Load itself, etc.
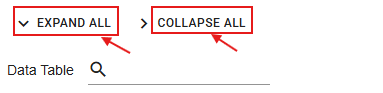
You also have the ability to Expand (or Collapse) all activities by clicking on the desired button over the top left part of the Data Table section.
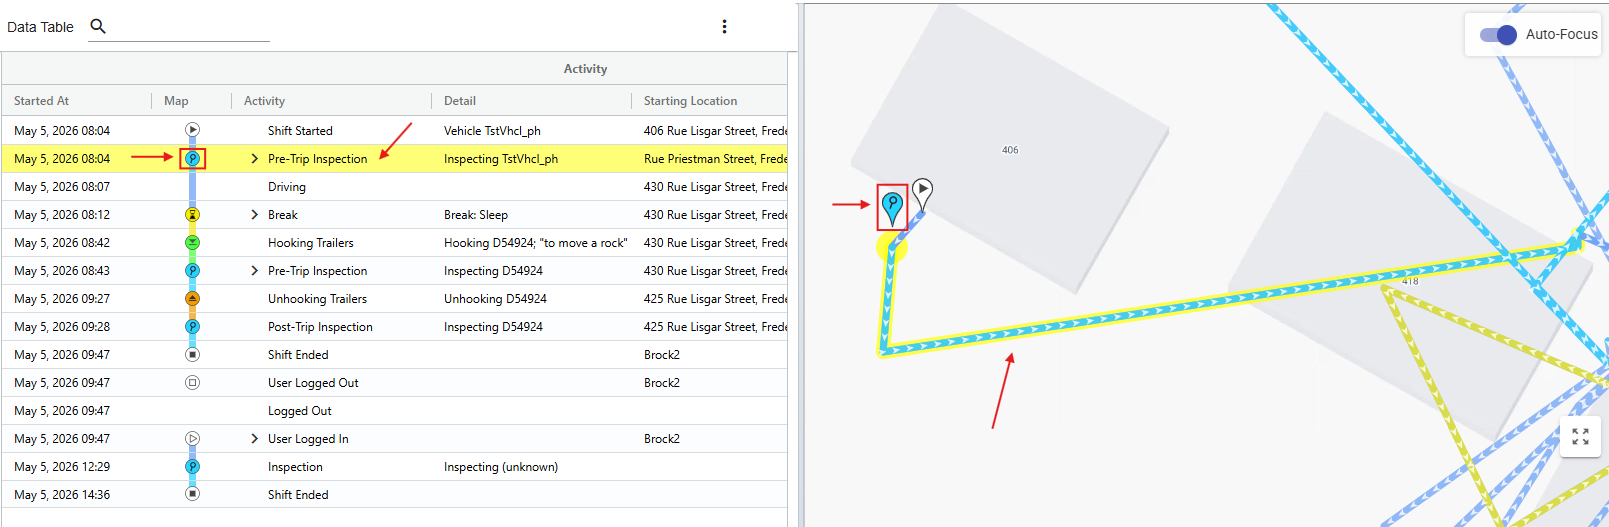
Clicking on each activity with a respective mapped route, and location, will highlight that part of the trip on both the Data Table, and the Map.
If the selected activity is not associated with “Driving”, such as Logging In/Out, Fueling, or Loading, a jumping pin icon will be displayed, and highlighted on the map.
Advanced Options
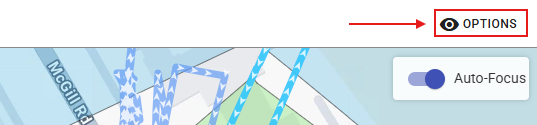
To modify advanced options, select the “Options” box over the top-right corner of the Map.
A pop-up menu with multiple toggle-on options will be displayed.
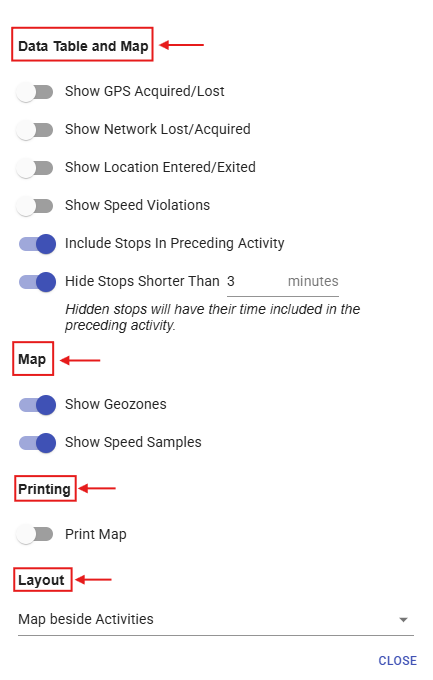
Show GPS Acquired/ Lost: Will display (a dropdown with the details of) the exact points of time where there was a GPS signal acquisition, or loss in the Data Table.
Show Network Lost/ Acquired: Will display (a dropdown with the details of) the exact points of time where the tablet’s cellular signal was acquired, or lost.
Show Location Entered/ Exited: Will display the enter, and exit locations on the map.
Show Speed Violations: Will highlight in Red the portions of the trip where there was a recorded speed violation.
Include Stops In Preceding Activity: Will include Known, or Unknown stops from the preceding activity.
Hide Stops Shorter than x Minutes: Will give you the ability to hide stops with desired duration.
Show Geozone: Will give you the ability to show/ hide Geozones on the map.
Show Speed Samples: Will give you the ability to show/ hide speed sampled events of the trip that can be viewed by zooming into the specific driving activity on the map and hovering over the larger, outlined arrows.
Print Map: If toggled on, the current map will be included when printing the reporting using the Print button at the top of the report page.
Layout: Will give you the ability to set the map to show beside, or beneath the Data Table.
You also have the ability to Print, Export, or Email the report by selecting your desired action on the top-right corner of the screen.

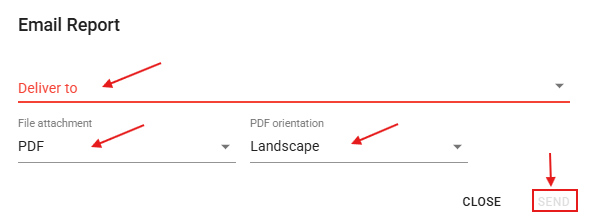
To Email a report, you need to click on the REPORT icon, and select “Email Report”. Choose your destination Email, or type one in the box, Choose your report’s Format, and Orientation, and click Send.
If you have any questions or issues regarding the Shift Summary report, please contact Navistream Support.
Navistream Support
1(844)571-8200 EXT 2
navistream@stti.ca